Hey folks, let’s cut through the noise today, because I’m seeing so many turn-to-turn tester suppliers and on-site techs asking the same dumb question: “What actually works for analyzing data from these bad boys?” Turn-to-turn Tester

First off, let’s set the scene for anyone who’s not deep in the weeds yet. If you’re a turn-to-turn tester (that’s our thing, and yeah, I run a small but tight-knit supplier team for these), you’re not just pushing buttons and passing parts. You’re testing aerospace wiring harnesses, electric vehicle battery packs, that fancy new avionics stack—stuff where a single tiny electrical glitch can crash a plane or blow a EV’s battery. The tester logs every little millisecond: voltage spikes, resistance dips, continuity gaps, even the tiniest signal bounce between two conductors. And that mountain of data? It’s useless if you can’t parse it fast.
I’ve been doing this for 8 years, and I’ve watched the software for this kind of analysis go from clunky, one-size-fits-all garbage to tools that actually get what turn-to-turn testers need. No more sifting through 100,000 rows of CSV data by hand. No more cross-referencing spreadsheets at 2 a.m. to figure out why a harness failed a mid-flight test. Let’s break down the tools we actually use (and swear by) at our shop, no paid shills here—just real supplier tea.
First up, and honestly the workhorse for 90% of our day-to-day: Python with Pandas, NumPy, and Matplotlib/Seaborn. Wait, I know what you’re thinking—“Python? That’s for devs, not testers.” But hear me out. Our turn-to-turn testers pump out raw data that’s messy. Like, reall messy. It’s usually time-series data with hundreds of channels, timestamp gaps, random sensor noise from the tester itself. Pandas lets us clean that data in minutes, not hours. We write quick, ugly little scripts (nothing fancy, just basic functions) to drop duplicate rows, fix timestamp drift, and isolate the exact test segment we care about. For example, if we run a 10-minute cycle on an EV harness, we can slice out only the 2-second window where the controller sends a high signal, so we’re not staring at irrelevant data.
NumPy is the next layer—we use it for math that would be impossible to do in Excel. Like, calculating the standard deviation of voltage across 500 conductors over 100 test runs, or finding the peak of a signal that’s buried under noise. And Matplotlib/Seaborn? We generate simple line charts, heatmaps, and histograms that we can send straight to our customers. No more waiting for the tester’s built-in report generator to spit out a generic graph that doesn’t highlight what’s actually broken. The best part? Python is free, so we don’t have to charge our customers extra for data analysis software—they just get the scripts we use, too. It’s a win-win.
But wait, Python is great for custom stuff, not for when you need a tool that’s built specifically for turn-to-turn testing data. That’s where our second go-to: NI LabVIEW. Yeah, I know LabVIEW gets a bad rap for being clunky and “g-language” (that’s the graphical coding stuff, right), but hear me out—this is the standard for test and measurement, period. Our turn-to-turn testers are integrated with NI hardware, so LabVIEW talks to them seamlessly. No weird API calls, no data conversion headaches. We use LabVIEW for real-time analysis during testing, not just post-processing. If a tester is running a high-stakes aerospace test, we can set up a LabVIEW script to flag a voltage drop below a threshold instantly, and pause the test before we waste parts. It’s also super useful for comparing test runs against a golden set—like, if a harness should have 5 ohms of resistance, LabVIEW will overlay the actual test data on the golden data in one graph, so you can see exactly where it diverges. The downside is it’s not cheap, but if you’re doing high-volume, high-stakes testing, it’s worth every penny.
Next up, a tool that I didn’t think I’d love as much as I do: Tableau. Wait, Tableau is for business analytics, right? But when you’re dealing with a ton of test data from multiple turn-to-turn testers across different sites, Tableau is perfect for visualizing trends. For example, if we have 5 testers running the same EV harness, we can connect all their data sources (CSV, LabVIEW logs, even cloud data) in Tableau and build a dashboard that shows which tester is producing the most noise, or which harness part is failing most often. Our customers love these dashboards because they can see trends without digging through data themselves. One of our big aerospace clients uses our Tableau dashboards to track test data across 12 of our testers, and they cut their time to root cause analysis by 40% last year. That’s a big deal when a glitch could delay a $100 million aircraft program.
Now, let’s talk about tools that we’ve tested and dumped, so you don’t have to waste time. First, Microsoft Excel. Don’t get me wrong, Excel is great for grocery lists and basic spreadsheets, but for turn-to-turn tester data? It’s garbage. Try importing a 100,000-row CSV into Excel, and it will crash. Try calculating standard deviation across 100 channels at once? It’s slow. And forget real-time analysis. We only use Excel for writing quick notes for customers, not actual data analysis. Second, R. R’s great for stats, but it’s even more of a dev tool than Python, and the learning curve is steeper. Our testers aren’t data scientists—they’re guys who wire harnesses and run tests. Python’s syntax is way more intuitive for them than R’s, so R never stuck. Third, generic data analysis tools like Power BI. It’s fine for business, but it doesn’t integrate with turn-to-turn testers at all. You have to export data, clean it, then import it into Power BI, which adds extra steps. We’d rather just use Tableau for that part.
Wait, let’s not forget about the tools that come with the turn-to-turn tester itself. A lot of new suppliers skip this, but the built-in software from the tester manufacturer is actually a great starting point. For example, if you buy a tester from a reputable company, their software will already have pre-built scripts for turn-to-turn testing—continuity tests, insulation resistance, signal integrity. You can export the raw data directly from there, so you don’t have to mess with protocol conversion. We always encourage our customers to use the built-in software first, then layer on Python or LabVIEW for deeper analysis. That way, they get the speed of the tester’s own tools plus the custom analysis they need.
Also, a big tip from my team: always choose software that works with your tester’s native data format. A lot of cheap turn-to-turn testers use proprietary formats, which means you can’t open the data in anything other than their software. Avoid those. We only sell testers that export to standard formats like CSV, JSON, and TDMS (that’s NI’s standard, super common for test data). That way, our customers can use any of the tools we talked about, no lock-in.
Let me give you a real example of how this works in action. Last quarter, we had a customer testing wiring harnesses for a new drone. Their turn-to-turn tester was logging data at 10,000 samples per second for each channel—120 channels total, so 1.2 million samples per second. They were using the tester’s built-in report generator, but it was only showing them average values, not the spikes that were causing signal interference. We had them use Python to clean the data (remove 5% of noisy baseline data), use NumPy to calculate the maximum peak voltage for each channel, and Matplotlib to generate a heatmap of peak voltages across all conductors. We found a tiny spike in one conductor that was buried in the noise, which the tester’s software missed. That conductor was touching another wire, causing signal interference, which would have made the drone crash during flight. The customer fixed it, and their first production run of 50 drones passed all tests. That’s the kind of thing good data analysis software does—finds the stuff that’s almost invisible, but critical.
Another example: we had another customer using LabVIEW for real-time analysis during high-voltage battery testing. Their turn-to-turn tester was running a 100-volt test, and LabVIEW was set to flag any voltage drop below 95 volts. Mid-test, it flagged a drop to 92 volts, paused the test, and showed them exactly which conductor was failing. If they had waited to run post-test analysis, they would have blown the battery pack, which costs $10,000 each. That’s why real-time analysis with LabVIEW is non-negotiable for high-stakes testing.
Now, let’s talk about what’s next. We’re starting to play with cloud-based tools like AWS QuickSight for our enterprise customers. They want to access their test data from anywhere, so QuickSight lets them share dashboards with their team, even across different time zones. It’s still new for us, but it’s a game-changer for customers who have remote engineering teams. But for most small to mid-sized shops, Python, LabVIEW, and Tableau are more than enough.
Wait, one thing I want to make clear: the best software isn’t the fanciest one. It’s the one that fits your needs. If you’re a small shop testing low-voltage electronics, Python is all you need. If you’re a big aerospace contractor running high-stakes tests every day, LabVIEW plus Tableau is the way to go. Don’t waste money on fancy tools you don’t need. And always make sure your software integrates with your turn-to-turn tester—no point in buying a tool that can’t read your data.
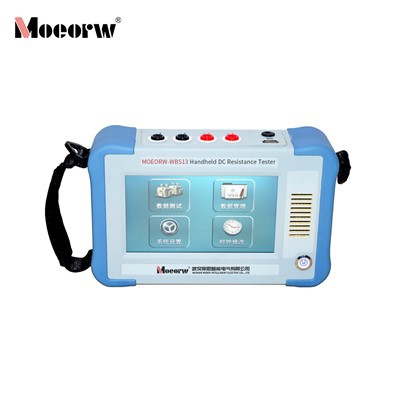
At the end of the day, as a turn-to-turn tester supplier, our job isn’t just to sell you a tester. It’s to make sure you can use that tester’s data to make good products. We help our customers set up their data analysis tools, write the Python scripts they need, and troubleshoot any issues. If you’re tired of sifting through messy tester data, missing glitches, or spending hours on analysis instead of testing, reach out to us. We’ll walk you through what works for your specific setup, no sales pitch, just real advice from someone who’s been in your shoes.
Oscillatory Wave Partial Discharge Tester References:
- National Instruments. "LabVIEW for Test and Measurement: Core Concepts and Applications." 2023.
- McKinney, Wes. "Python for Data Analysis: Data Wrangling with Pandas, NumPy, and IPython." O’Reilly Media, 2022.
- Tableau Software. "Test Data Visualization: Turning Raw Test Results into Actionable Insights." 2024.
- Turn-to-Turn Testing Industry Association. "Best Practices for Electrical Wiring Harness Testing and Data Analysis." 2023.
Wuhan Moen Intelligent Electric Co., Ltd.
As one of the most professional turn-to-turn tester manufacturers in China, we’re featured by quality products and good price. Please rest assured to buy high quality turn-to-turn tester in stock here and get quotation from our factory. Customized orders are welcome.
Address: Building A, No.1, Fenghuangyuan 2nd Road, Donghu New Technology Development Zone, Wuhan, Hubei, China
E-mail: info@hvhipotsystem.com
WebSite: https://www.hvhipotsystem.com/
